by Joey Beachum | Jun 17, 2019 | How To Measure Anything in Cybersecurity Risk, News

In every industry, the risk of cyber attack is growing.
In 2015, a team of researchers forecasted that the maximum number of records that could be exposed in breaches – 200 million – would increase by 50% from then to 2020. According to the Identity Theft Resource Center, the number of records exposed in 2018 was nearly 447 million – well over 50%. By 2021, damages from cybersecurity breaches will cost organizations $6 trillion a year. In 2017, breaches cost global companies an average of $3.6 million, according to the Ponemon Institute.
It’s clear that this threat is sufficiently large to rank as one of an organization’s most prominent risks. To this end, corporations have entire cybersecurity risk programs in place to attempt to identify and mitigate as much risk as possible.
The foundation of accurate cybersecurity risk analysis begins with knowing what is out there. If you can’t identify the threats, you can’t assess their probabilities – and if you can’t assess their probabilities, your organization may be exposed by a critical vulnerability that won’t make itself known until it’s too late.
Cybersecurity threats may vary in specific from entity to entity, but in general, there are several common dangers that may be flying under the radar – and may be some you haven’t seen coming until now.
A Company’s Frontline Defense Isn’t Keeping Up the Pace
Technology is advancing at a more rapid rate than at any other point in human history: concepts such as cloud computing, machine learning, artificial intelligence, and Internet of Things (IoT) provide unprecedented advantages, but also introduce distinct vulnerabilities.
This rapid pace requires that cybersecurity technicians stay up to speed on the latest threats and mitigation techniques, but this often doesn’t occur. In a recent survey of IT professionals conducted by (ISC)^2, 43% indicated that their organization fails to provide adequate ongoing security training.
Unfortunately, leadership in companies large and small have traditionally been reluctant to invest in security training. The primary reason is mainly psychological; decision-makers tend to view IT investment in general as an expense that should be limited as much as possible, rather than as a hedge against the greater cost of failure.
Part of the reason why this phenomenon exists is due to how budgets are structured. IT investment adds to operational cost. Decision-makers – especially those in the MBA generation – are trained to reduce operational costs as much as possible in the name of greater efficiency and higher short-term profit margins. This mindset can cause executives to not look at IT investments as what they are: the price of mitigating greater costs.
Increases in IT security budgets also aren’t pegged to the increase of a company’s exposure, which isn’t static but fluctuates (and, in today’s world of increasingly-sophisticated threats, often increases).
The truth is, of course, that investing in cybersecurity may not make a company more money – a myopic view – it can keep a company from losing more money.
Another threat closely related to the above is how decision-makers tend to view probabilities. Research shows that decision-makers often overlook the potential cost of a negative event – like a data breach – in favor of its relatively-low probability (i.e. “It hasn’t happened before, or it probably won’t happen, so we don’t have to worry as much about it.”). These are called tail risks, risks that have disproportionate costs to their probabilities. In other words, they may not happen as frequently, but when they do, the consequences are often catastrophic.
There’s also a significant shortfall in cybersecurity professionals that is inducing more vulnerability into organizations that already are stressed to their maximum capacity. Across the globe, there are 2.93 million fewer workers than are needed. In North America, that number, in 2018, was just under 500,000.
Nearly a quarter of respondents in the aforementioned (ISC)^2 survey said they had a “significant shortage” in cybersecurity staff. Only 3% said they had “too many” workers. Overall, 63% of companies reported having fewer workers than they needed. And 59% said they were at “extreme or moderate risk” due to their shortage. (Yet, 43% said they were either going to not hire any new workers or even decrease the number of security personnel on their rosters.)
A combination of less training, inadequate budgets, and fewer workers all contribute to a major threat to security that many organizations fail to appreciate.
Threats from Beyond Borders Are Difficult to Assess – and Are Increasing
Many cybersecurity professionals correctly identify autonomous individuals and entities as a key threat – the stereotypical hacker or a team within a criminal organization. However, one significant and overlooked vector is the threat posed by other nations and foreign non-state actors.
China, Russia, and Iran are at the forefront of countries that leverage hacking in a state-endorsed effort to gain access to proprietary technology and data. In 2017, China implemented a law requiring any firm operating in China to store their data on servers physically located within the country, creating a significant risk of the information being accessed inappropriately. China also takes advantage of academic partnerships that American universities enjoy with numerous companies to access confidential data, tainting what should be the purest area of technological sharing and innovation.
In recent years, Russia has noticeably increased its demand to review the source code for any foreign technology being sold or used within its borders. Finally, Iran contains numerous dedicated hacking groups with defined targets, such as the aerospace industry, energy companies, and defense firms.
More disturbing than the source of these attacks are the pathways they use to acquire this data – including one surprising method. A Romanian source recently revealed to Business Insider that when large companies sell outdated (but still functional) servers, the information isn’t always completely wiped. The source in question explained that he’d been able to procure an almost complete database from a Dutch public health insurance system; all of the codes, software, and procedures for traffic lights and railway signaling for several European cities; and an up-to-date employee directory (including access codes and passwords) for a major European aerospace manufacturer from salvaged equipment.
A common technique used by foreign actors in general, whether private or state-sponsored, is to use legitimate front companies to purchase or partner with other businesses and exploit the access afforded by these relationships. Software supply chain attacks have significantly increased in recent years, with seven significant events occurring in 2017, compared to only four between 2014 and 2016. FedEx and Maersk suffered approximately $600 million in losses from a single such attack.
The threat from across borders can be particularly difficult to assess due to distance, language barriers, a lack of knowledge about the local environment, and other factors. It is, nonetheless, something that has to be taken into consideration by a cybersecurity program – and yet often isn’t.
The Biggest Under-the-Radar Risk Is How You Assess Risks
While identifying risks is the foundation of cybersecurity, appropriately analyzing them is arguably more important. Many commonly used methods of risk analysis can actually obscure and increase risk rather than expose and mitigate it. In other words, many organizations are vulnerable to the biggest under-the-radar threat of them all: a broken risk management system.
Qualitative and pseudo-quantitative methods often create what Doug Hubbard calls the “analysis placebo effect,”(add footnote) where tactics are perceived to be improvements but offer no tangible benefits. This can increase vulnerabilities by instilling a false sense of confidence, and psychologists have shown that this can occur even when the tactics themselves increase estimate errors. Two months before a massive cyber attack rocked Atlanta in 2018, a risk assessment revealed various vulnerabilities, but the fix actions to address these fell short of actually resolving the city’s exposure—although officials were confident they had adequately addressed the risk.
Techniques such as heat maps, risk matrices, and soft scoring often fail to inform an organization regarding which risks they should address and how they should do so. Experts indicate that “risk matrices should not be used for decisions of any consequence,<fn>Thomas, Philip & Bratvold, Reidar & Bickel, J. (2013). The Risk of Using Risk Matrices. SPE Economics & Management. 6. 10.2118/166269-MS.</fn>” and they can be even “worse than useless.<fn>Anthony (Tony) Cox, L. (2008), What’s Wrong with Risk Matrices?. Risk Analysis, 28: 497-512. doi:10.1111/j.1539-6924.2008.01030.x</fn>” Studies have repeatedly shown, in numerous venues, that collecting too much data, collaborating beyond a certain point, and relying on structured, qualitative decision analyses consistently produce worse results than if these actions had been avoided.
It’s easy to assume that many aspects of cybersecurity are inestimable, but we believe that anything can be measured. If it can be measured, it can be assessed and addressed appropriately. A quantitative model that circumvents overconfidence commonly seen with qualitative measures, uses properly-calibrated expert assessments, knows what information is most valuable and what isn’t, and is built on a comprehensive, multi-disciplinary framework can provide actionable data to guide appropriate decisions.
Bottom line: not all cybersecurity threats are readily apparent, and the most dangerous ones can easily be ones you underestimate, or don’t see coming at all. Knowing which factors to measure and how to quantify them can help you identify the most pressing vulnerabilities, which is the cornerstone of effective cybersecurity practices
For more information on how to create a more effective cybersecurity system based on quantitative methods, check out our How to Measure Anything in Cybersecurity Risk webinar.
by Joey Beachum | May 22, 2019 | How To Measure Anything Blogs, News

What follows is a tale that, for business people, reads like a Shakespearean tragedy – or a Stephen King horror novel. It starts with the recent history-setting success of Avengers: Endgame and the notion that an idea has value – and if you don’t see it or won’t realize it, someone else will.
The year is 1998. As explained in this Wall Street Journal piece, Sony Pictures wanted to buy the rights to produce Spider-Man movies. Marvel Entertainment, who owned the rights, needed cash because they had just came out of bankruptcy. So, Marvel essentially told Sony that not only could it have the rights to Spider-Man, it could have the rights to almost every Marvel character for the low-low sum of $25 million.
These Marvel characters? They included Iron Man, Thor, Black Panther, and others. You may recognize those names, unless you’ve sworn off entertainment altogether for the past decade.
Sony said “No thanks, we just want Spider-Man,” and only paid $10 million in cash.
Eleven years and 22 movies later, the Marvel Cinematic Universe (MCU) has grossed a staggering $19.9 billion (as of 4/30/2019) – and they’re not done making movies, with plenty more on the way.
Sony’s decision was an epically bad one, of course, but only in hindsight. There’s no guarantee that even if they had bought the rights that they would’ve had the same success. Besides, there’s no way they could’ve predicted just how valuable the franchise would turn out to be. After all, at the time, the cinematic prospects for many of the characters that were for sale were low, to say the least. Part of that is due to a decade-long slide in quality and popularity for Marvel in the 1990s that eventually lead to its bankruptcy.
Measuring value for an idea is impossible. You just can’t predict what movies – or books, or songs, or works of art, or ideas in general – will be successful…right?
Finding the Next Hit: Measuring the Potential Value of an Idea
One pervasive belief is that you can’t measure or quantify an intangible thing like an idea, like a movie. People believe that you can only quantify tangible things, and even then, it’s difficult to forecast what will happen.
Ideas, though, can be measured just like anything else. Can you put an exact number on an intangible concept, like whether or not a movie will be a success? No – but that’s not what measurement and quantification are, really.
At its most basic, measurement is just reducing the amount of uncertainty you have about something. You don’t have to put an exact number on a concept to be more certain about it. For example, Sony Pictures wasn’t certain how much a Spider-Man movie would make, but it was confident that the rights were worth more than $10 million.
One of the most successful superhero movies in the 1990’s – Batman Forever, starring Val Kilmer, Jim Carrey, and Tommy Lee Jones – raked in $336.5 million on a then-massive budget of $100 million.
If we’re Sony and we think Spider-Man is roughly as popular as Batman, we can reasonably guess that a Spider-Man movie could do almost as well. (Even a universally-panned superhero movie, Batman & Robin, grossed $238.2 million on a budget of $125 million.) We can do a quick-and-dirty proxy of popularity by comparing the total number of copies sold for each franchise.
Unfortunately there’s a huge gap in data for most comics between 1987 and the 2000’s. No matter. We can use the last year prior to 1998 in which there was industry data for both characters. Roughly 150,000 copies of Batman comics were sold in 1987, versus roughly 170,000 copies of Spider-Man.
Conclusion: it’s fair to say that Spider-Man, in 1998, was probably as popular as Batman was before Batman’s first release, the simply-named Batman in 1989 with Michael Keaton and a delightfully-twisted Jack Nicholson. Thus, Sony was making a good bet when it bought the rights to Spider-Man in 1998.
Uncertainty, then, can be reduced. The more you reduce uncertainty through measurement, the better the decision will be, all other things considered equal. You don’t need an exact number to make a decision; you just have to get close enough.
So how can we take back-of-the-envelope math to the next level and further reduce uncertainty about ideas?
Creating a Probabilistic Model for Intangible Ideas
Back-of-the-envelope is well and good if you want to take a crack at narrowing down your initial range of uncertainty. But if you want to further reduce uncertainty and increase the probability of making a good call, you’ll have to start calculating probability.
Normally, organizations like movie studios (and just about everyone else) turn to subject matter experts to assess the chances of something happening, or to evaluate the quality or value of something. These people often have years to decades of experience and have developed a habit of relying on their gut instinct when making decisions. Movie executives are no different.
Unfortunately, organizations often assume that expert judgment is the only real solution, or, if they concede the need for quantitative analysis, they often rely too much on the subjective element and not enough on the objective. This is due to a whole list of reasons people have for dismissing stats, math, analytics, and the like.
Doug Hubbard ran into this problem years ago when he tapped to do exactly what the Sony executives should’ve done in 1998: create a statistical model that will predict the movie projects most likely to succeed at the box office. He tells the story from his book How to Measure Anything: Finding the Value of “Intangibles” in Business:
The people who are paid to review movie projects are typically ex-producers, and they have a hard time imagining how an equation could outperform their judgment. In one particular conversation, I remember a script reviewer talking about the need for his “holistic” analysis of the entire movie project based on his creative judgment and years of experience. In his words, the work was “too complex for a mathematical model.”
Of course, Doug wasn’t going to leave it at that. He examined the past predictions about box office success for given projects that experts had made, along with how much these projects actually grossed, and he found no correlation between the two. In fact, projections overestimated the performance of a movie at the box office nearly 80% of the time – and underestimated performance only 20% of the time.
Figure 1 compares expert assessment and a model of expert estimates, using data points from small-budget indie films:
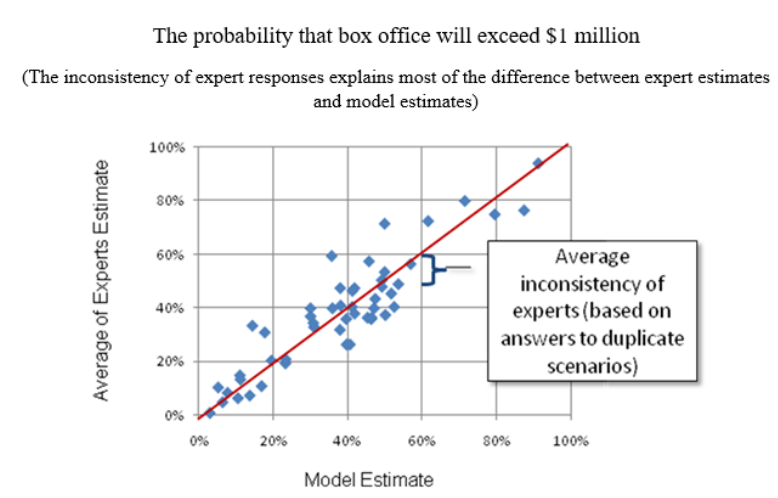 Figure 1: Comparison Between Expert Estimates and the Model Estimate
As Doug says, “If I had developed a random number generator that produced the same distribution of numbers as historical box office results, I could have predicted outcomes as well as the experts.”
He did, however, gain a few crucial insights from historical data. One was that there was a correlation between the distributor’s marketing budget for a movie and how well the movie performed at the box office. This led him to the final conclusion of his story:
Using a few more variables, we created a model that had a…correlation with actual box office results. This was a huge improvement over the previous track record of the experts.
Was the model a crystal ball that made perfect, or even amazingly-accurate predictions? Of course not. But – and this is the entire point – the model reduced uncertainty in a way that the studio’s current methods could not. The studio in question increased its chances of hitting paydirt with a given project – which, given just how much of a gamble making a movie can be, is immensely valuable.
The process for creating a model is less complicated than you might think. If you understand the basic process, as shown below in Figure 2, you have a framework to measure anything:
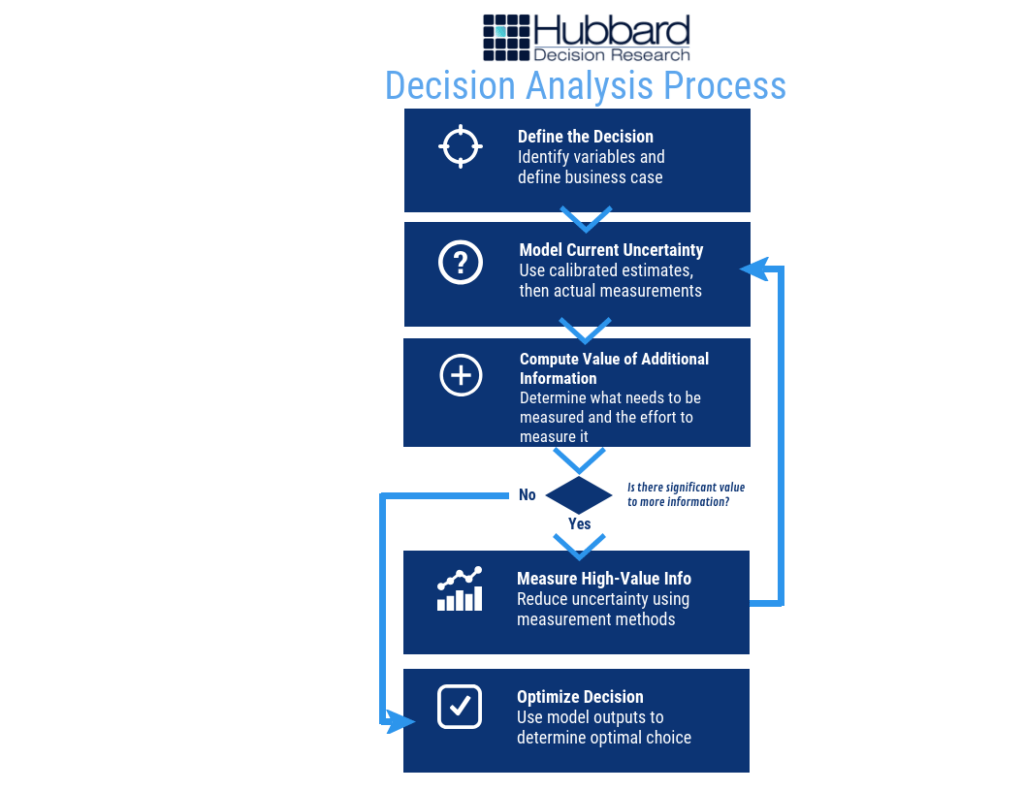 Figure 2: Decision Analysis Process
At its core, a model takes variables – anything from distributor budget for movies to, say, technology adoption rate for business projects – and uses calibrated estimates, historical data, and a range of other factors to put values on them. Then, the model applies a variety of statistical methods that have been shown by research and experience to be valid and creates an output that can look like this in Figure 3 (the numbers are just an example) :
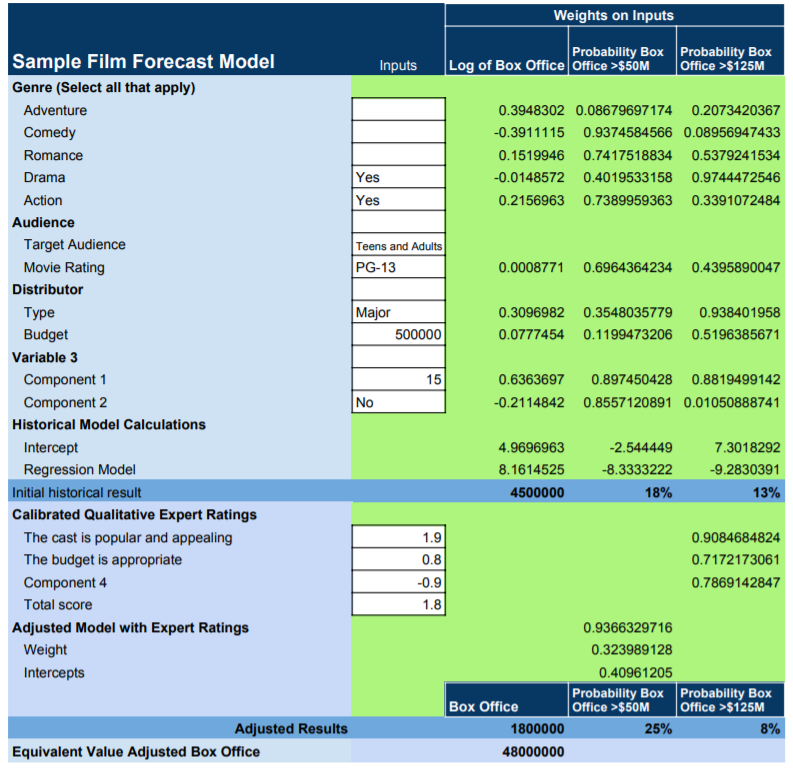 Figure 3: Sample Film Forecast Model
What’s the Next Big Hit?
The next big hit – whether it’s a movie, an advertising campaign, a political campaign, or a ground-breaking innovation in business – can be modeled beyond mere guesswork or even expert assessment. The trick – and really, the hard part – is figuring out how to measure the critical intangibles inherent to these abstract concepts. The problem today is that most quantitative models skip them altogether.
But intangibles are important. How much your average fan loves a character, and will spend hard-earned money to go to a movie theatre to see an upcoming film about, say, a biochemist-turned-vampire named Morbius, will ultimately help to determine success. Expressed in that desire – in any desire – are any number of innate human motivations and components of personality that can be measured.
(By the way, the aforementioned Morbius movie is being made by Sony as a part of the Marvel Cinematic Universe. Better late than never, although you don’t need a model to predict Morbius won’t gross as much as Avengers: Endgame, despite how cool the character may be.
In this world, precious few things are certain. But with a little math and a little ingenuity, you can measure anything – and if you can measure it, you can model and forecast it and get a much better idea of what will be the next great idea – and the next big hit.
by Joey Beachum | May 18, 2019 | How To Measure Anything Blogs, News, The Failure of Risk Management Blogs

Risk management isn’t easy.
At any given time, an organization faces many risks, both known and unknown, minor and critical. Due to limited resources, not all risks can be mitigated. Without an effective risk management process, not all risks can even be identified. Thus, a risk manager’s job is to figure out how to best allocate his or her resources to best protect the organization. The only way to do so in an organized fashion is to have a risk management process – but there’s a big kicker: it has to work.
And as we’ve learned from the past three decades, it’s not a given that a process works as well as it needs to. Often, unfortunately, processes just aren’t very effective, and can actually harm more than they help.
When assessing the performance and effectiveness of your risk management process, it helps if you undertake a rigorous, critical examination of the process, starting with one question: How do I know my methods work?
Before you answer, we need to clarify what this means. By “works” we mean a method that measurably reduces error in estimates, and improves average return on portfolios of decisions compared to expert intuition or an alternative method.
Note that this is not the same as merely perceived benefits. If, for example, estimates of project cost overruns are improved, that should be objectively measurable by comparing original estimates to observed outcomes. Merely using a survey to ask managers their opinions about the benefits of a method won’t do.
Why We Can’t Rely on Our Perception
The reason we can’t rely on the mere perception of effectiveness is that we are all susceptible to a kind of “analysis placebo effect.” That is, research shows that we can increase our confidence at a task while not improving or even getting worse.
For example, it has been shown that just using more data or more “rigor”, even when there is no real measurable improvement, has increased confidence – but not accuracy – in estimating the outcomes of law enforcement interrogations, sporting events, and portfolio returns<fn>DePaulo, B. M., Charlton, K., Cooper, H., Lindsay, J.J., Muhlenbruck, L. “The accuracy-confidence correlation in the detection of deception” Personality and Social Psychology Review, 1(4) pp 346-357, 1997)</fn>.
Merely having a system also doesn’t guarantee effectiveness or improvement. In one study in Harvard Business Review, the authors found that an analysis of over 200 popular management tools and processes had a surprising result: “Most of the management tools and techniques we studied had no direct causal relationship to superior business performance.”<fn>Kassin, S.M., Fong, C.T. “I’m innocent!: Effect of training on judgments of truth and deception in the interrogation room” Law and Human Behavior, 23 pp 499-516, 1999)</fn>
Throw in a myriad of reasons why humans are naturally bad at assessing probability and one can see that any risk management system predicated on subjective, uncalibrated human assessment is, by itself, inherently ineffective at best and dangerous at worst.
It makes sense, then, that if your risk management system fits the above (e.g. it has risk matrices, heat maps, and other pseudo-quantitative, subjective “measurement” systems), it may not be working nearly well as you want.
To be sure, you have to be able to measure how well your risk management system is measuring risk.
Measuring How You Make Measurements
So, how can we measure real improvements? Ideally, there would be some big survey been conducted which tracked multiple organizations over a long period of time which showed that some methods are measurably outperforming others. Did 50 companies using one method over a 10-year period actually have fewer big loss events than another 50 companies using another method over the same period? Or were returns on portfolios of investments improved for the first group compared to the second group? Or were events at least predicted better?
Large scale research like that is rare. But there is a lot of research on individual components of methods, if not the entire methodology. Components include the elicitation of inputs, controls for various errors, use of historical data, specific quantitative procedures, and so on. What does the research say about each of the parts of your method? Also, is there research that shows that these components make estimates or outcomes worse?
Let’s look at the most direct answer to how you can measure your improvements: having a quantitative model. Over 60 years ago, psychologist Paul Meehl studied how doctors and other clinicians made predictions in the form of patient prognoses and found something that was, for the time (and still today) very startling: statistical methods were consistently superior to the clinical judgments rendered by medical experts.<fn>N. Nohria, W. Joyce, and B. Roberson, “What Really Works,” Harvard Business Review, July 2003</fn> In 1989, another paper further solidified the notion that quantitative models – in this study, represented by actuarial science – outperform experts<fn>P.E. Meehl, Clinical Versus Statistical Prediction: A Theoretical Analysis and a Review of the Evidence. (Minneapolis, University of Minnesota Press, 1958)</fn>.
Calibrating experts so they can assess probabilities with more accuracy and (justifiable) confidence has also been shown to measurably improve the performance of a risk management system<fn>R.M. Dawes, D. Faust, and P.E. Meehl, “Clinical Versus Actuarial Judgment,” Science, 243(4899) (1989): 1668-1674</fn>. Calibration corrects for innate human biases and works for about 85% of the population. The results are quantifiable, as evidenced by the image below compiled from calibrating nearly 1,500 individuals over the past 20 years (Figure 1):
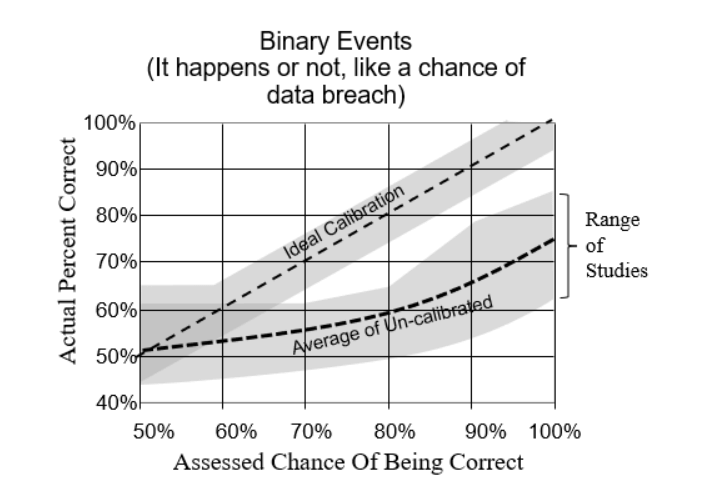
Figure 1: Difference Between Calibrated and Uncalibrated Assessments
Other tools, such as Monte Carlo simulations and Bayesian methods, have also been shown to measurably improve the performance of a quantitative model. So, as we mentioned above, even if you don’t have exhaustive data to verify the effectiveness of the model in whole, you can still test the effectiveness of each individual component.
The bottom line: If you can’t quantitatively and scientifically test the performance and validity of your risk management process, then it probably is causing more error – and risk – than it’s reducing.
This research has already been done and the results are conclusive. So, the only other question is why not get started on improvements now?

by Joey Beachum | Nov 6, 2018 | How To Measure Anything Blogs, News
When it comes to statistics, there are a lot of misconceptions floating around. Even people who have scientific backgrounds subscribe to some of these common misconceptions. One misconception that affects measurement in virtually every field is the perceived need for a large sample size before you can get useful information from a measurement.
Measurements are often dismissed, without doing any actual math, because someone believes they need a larger sample size to be “statistically significant.” We see examples of this line of thought everywhere. In sports, for example, we dismiss predictive metrics because they naturally work with small sample sizes (a season is only so long, with only so many games, after all), choosing instead to go with “gut feel” and “expert knowledge.”
In other words, a measurement isn’t useless if the sample size is small. You can actually use small sample sizes to learn something useful about anything – even, as we’ll soon see, with really small samples.
And if you can learn something useful using the limited data you have, you’re one step closer to measuring anything you need to measure – and thus making better decisions. In fact, it is in those very situations where you have a lot of uncertainty, that a few samples can reduce uncertainty the most. In other words, if you know almost nothing, almost anything will tell you something.
In How to Measure Anything: Finding the Value of Intangibles in Business, Doug Hubbard uses two under-the-radar statistical principles to demonstrate how even small amounts of data can provide a lot of useful insight: the Rule of Five and the Urn of Mystery.
The Rule of Five
Pretend for a moment that you’re a decision-maker for a large corporation with 10,000 employees. You’re considering automating part of some routine activity, like scheduling meetings or preparing status reports. But you are facing a lot of uncertainty and you believe you need to gather more data. Specifically, one thing you’re looking for is how much time the typical employee spends each day commuting.
How would you gather this data?
You could create what essentially would be a census where you survey each of the 10,000 employees. But that would be very labor-intensive and costly. You probably wouldn’t want to go through that kind of trouble. Another option is to get a sample, but you are unsure what the sample size should be to be useful.
What if you were told that you might get enough information to make a decision by sampling just five people?
Let’s say that you randomly pick five people from your company. Of course, it’s hard for humans to be completely random, but let’s assume the picking process was about as random as you can get.
Then, let’s say you ask these five people to give you the total time, in minutes, that they spend each day in this activity. The results come in: 30, 60, 45, 80, and 60 minutes. From this, we can calculate the median of the sample results, or the point at which exactly half of the total population (10,000 employees) is above the median and half is below the median.
Is that enough information?
Many people, when faced with this scenario, would say the sample is too small – that it’s not “statistically significant.” But a lot of people don’t know what statistically significant actually means.
Let’s go back to the scenario. What are the chances that the median time spent in this activity for 10,000 employees, is between 30 minutes and 80 minutes, the low and high ends, respectively, of the five-employee survey?
When asked, people often say somewhere around 50%. Some people even go as low as 10%. It makes sense, after all; there are 10,000 employees and countless individual commute times in a single year. How can a sample that is viewed as not being statistically significant possibly get close?
Well, here’s the answer: the chances that the median time spent of the population of 10,000 employees is between 30 minutes and 80 minutes is a staggering 93.75%.
In other words, you can be very confident that the median time spent is between 30 minutes and 80 minutes, just by asking five people out of 10,000 (or 100,000, or 1,000,000 – it’s all the same math).
This may seem like a wide range, but that’s not the point. The relevant point is whether this range is narrower than your previous range. Maybe you previously thought that 5 minutes per day or 2.5 hours per day were reasonable given what you knew at the time. These values now would be highly unlikely to be medians for the population. Even with a small measurement of just five people, you significantly narrowed your range of uncertainty. If your uncertainty was that high before, you now have a much better idea.
Now suppose the proposed investment breaks even if the median time spent is 10 minutes per person per day. That is, if the median time spent is any higher than 10 minutes, the proposed investment will do better than break even. In this case you’ve already reduced uncertainty enough to be confident in a decision to invest. Likewise, you would be confident to reject the investment if the breakeven was 2 hours. If your break even was, say 45 minutes, you might consider further sampling before you make a decision.
So, making better decisions is all about getting valuable information from measuring data. But it doesn’t take a lot of data to give you something useful to work with.
What if you could learn something useful with even less information?
The Urn of Mystery
Picture yourself in a warehouse. In front of you stands a man – we’ll say that he is dressed like a carnival barker, complete with fancy red coat, a top hat, and a mischievous look on his face. (This is a far cry from your usual corporate office environment.)
The carnival barker waves his arm toward the inside of the warehouse. You see rows and rows of large urns. You try to count them but they just keep going and going into the dark recesses of the warehouse.
“Each urn,” he says to you, “is filled with marbles – let’s say 100,000 marbles per urn. Every marble in these urns is either red or green. But, the mixture of red and green marbles varies from urn to urn. An urn could have 100% green marbles and 0% red marbles. Or 33% green marbles and 67% red marbles. Or it could be an even split, 50-50. Or anything else in between 0 to 100%. All percentages are equally likely. And assume that the marbles in each urn have been thoroughly and randomly mixed.”
The barker continues. “Here’s my proposition. We’ll play a betting game. We’ll choose an urn at random. Then, I’ll bet that the marbles in that urn are either mostly red or mostly green. I’ll give you 2-to-1 odds, and each time you’ll bet $10. That is, if I guess correctly, you lose $10. If I’m wrong, you will win $20. We’ll play through 100 urns. Wanna take the bet?” he asks with a smile.
You know that if it’s a uniform distribution, where all percentages are equally likely, the barker will be right 50% of the time. That means your average gain per bet is $5 (a 50% chance of losing $10 and 50% of gaining $20=(0.5)(-10)+(0.5)(20)=5). So, over 100 urns, you’ll net about $500 – give or take $100 or so – by the end of the game. Sounds like a smart bet.
“It’s a deal,” you say.
“Well, let’s make it a bit more fair for me,” the barker says. “Let me draw just one marble, chosen at random, from an urn before I make my pick. This will be completely random. There’s a special spigot at the bottom that will give me a single marble without allowing me to see the rest. Will you still play the game with me?”
You are probably like most people in thinking that one little marble in a large urn full of marbles isn’t going to matter. It’s too small of a sample size, right?
“You’re on,” you say, and the barker grins because he know he has you.
Most people think that the additional information either doesn’t help the barker at all or provides, at best, a small, marginal advantage – that he’ll win 51% of the time as opposed to 50%, or something like that. After all, there are 100,000 marbles.
If you’re still getting 2-to-1 odds, 51% isn’t much different than 50%. You’ll still win.
Do you know the barker’s new win percentage? Believe it or not, by taking just one sample out of each urn, his win percentage jumps from 50% to 75%. That’s an increase of 50%. So you’ll actually walk away from the game a loser.
This is called the Single Sample Majority Rule, which put formally says, “Given maximum uncertainty about a population proportion – such that you believe the proportion could be anything between 0% and 100% with all values being equally likely – there is a 75% chance that a single randomly selected sample is from the majority of the population.”
You now have actionable insight, more than you had before you started, with one, simple sample. Better walk away from this bet.
Applying These Principles to Measuring Anything
What the Rule of Five and Urn of Mystery teach you is this: when you attempt to measure something, assuming your methods are sound, you’re giving yourself more actionable data for better decisions that is better than simple intuition or gut feel.
Our intuition is often wrong when it comes to statistics and quantitative analysis. We can’t possibly believe that we can gain anything useful from a small sample size. And then there’s the issue of statistical significance.
Here’s the thing: when you measure something, you reduce your uncertainty, which is the best thing you can do to make a better decision. And when you have a lot of uncertainty (e.g., in the case of the urns where the share of marbles of a specific color could be anywhere between 0 and 100%), then even the first random sample can reduce uncertainty a lot.
The first step, though, is to believe that your intuition about statistics, probability, mathematics, and quantitative analysis is probably wrong. There are misconceptions keeping you from making better decisions through measuring and analyzing data. Decision-makers deal with these misconceptions all the time, and the result is that they’re not making the best decisions that they possibly could.
If you can get past raw intuition, or “gut feel,” like so many decision-makers and experts bank on, and you embrace quantitative decision analysis, you can gather more information even using ridiculously small sample sizes like in the Rule of Five or Urn of Mystery.
Don’t be afraid of not knowing what to measure, though. David Moore, former president of the American Statistical Association, once said, “If you don’t know what to measure, measure anyway. You’ll learn what to measure.” Doug calls this the Nike method: the “Just do it” school of thought.
You don’t need a large sample size to begin to measure something, even an intangible that you think is impossible to measure. Even with a small sample size, you can reduce your range of uncertainty – and, therefore, be on your way to making better decisions.
by Matt Millar | Mar 24, 2017 | Articles, Bayesian vs. Frequentist?, How To Measure Anything Blogs, News, What's New
Pop quiz: which of the following statements about decisions do you agree with:
- You need at least thirty data points to get a statistically significant result.
- One data point tells you nothing.
- In a business decision, the monetary value of data is more important than its statistical significance.
- If you know almost nothing, almost anything will tell you something.
(more…)
by Douglas Hubbard | Aug 7, 2016 | How To Measure Anything in Cybersecurity Risk
Welcome to the new How To Measure Anything in Cybersecurity Risk blog. In this blog you will find information about the first new book in the How To Measure Anything Series. Co-authored by Douglas Hubbard and Richard Seiersen.
For downloads, visit the official How To Measure Anything in Cybersecurity Risk site.
